Glass-to-Glass Latency: WebRTC vs RTSP vs Cloudflare (Real Measurements)
We pointed a drone camera at a millisecond clock and measured end-to-end video latency over five paths: WHEP over Tailscale, QGroundControl, RTSP, and Cloudflare in QGC and the browser. 25 screenshots, every frame shown.
Latency numbers on spec sheets are easy to write and hard to trust. So we measured ours the simplest honest way: point the drone camera at a screen running a millisecond clock, put the received video next to that same clock, and take screenshots. Each screenshot freezes both clocks in one frame, so latency = reference clock − clock seen in the video. We took five screenshots per path and show every one of them below.
Results
| Path | Camera | Player | Glass-to-glass |
|---|---|---|---|
| WHEP in the browser, direct over Tailscale | OpenIPC | Browser (WHEP) | ~339 ms |
| QGroundControl | OpenIPC | QGC | ~356 ms |
| QGroundControl over RTSP | OpenIPC | QGC (RTSP) | ~365 ms |
| Cloudflare, played in QGroundControl | ViewPro (1080p25, ~3.2 Mbps) | QGC | ~300 ms |
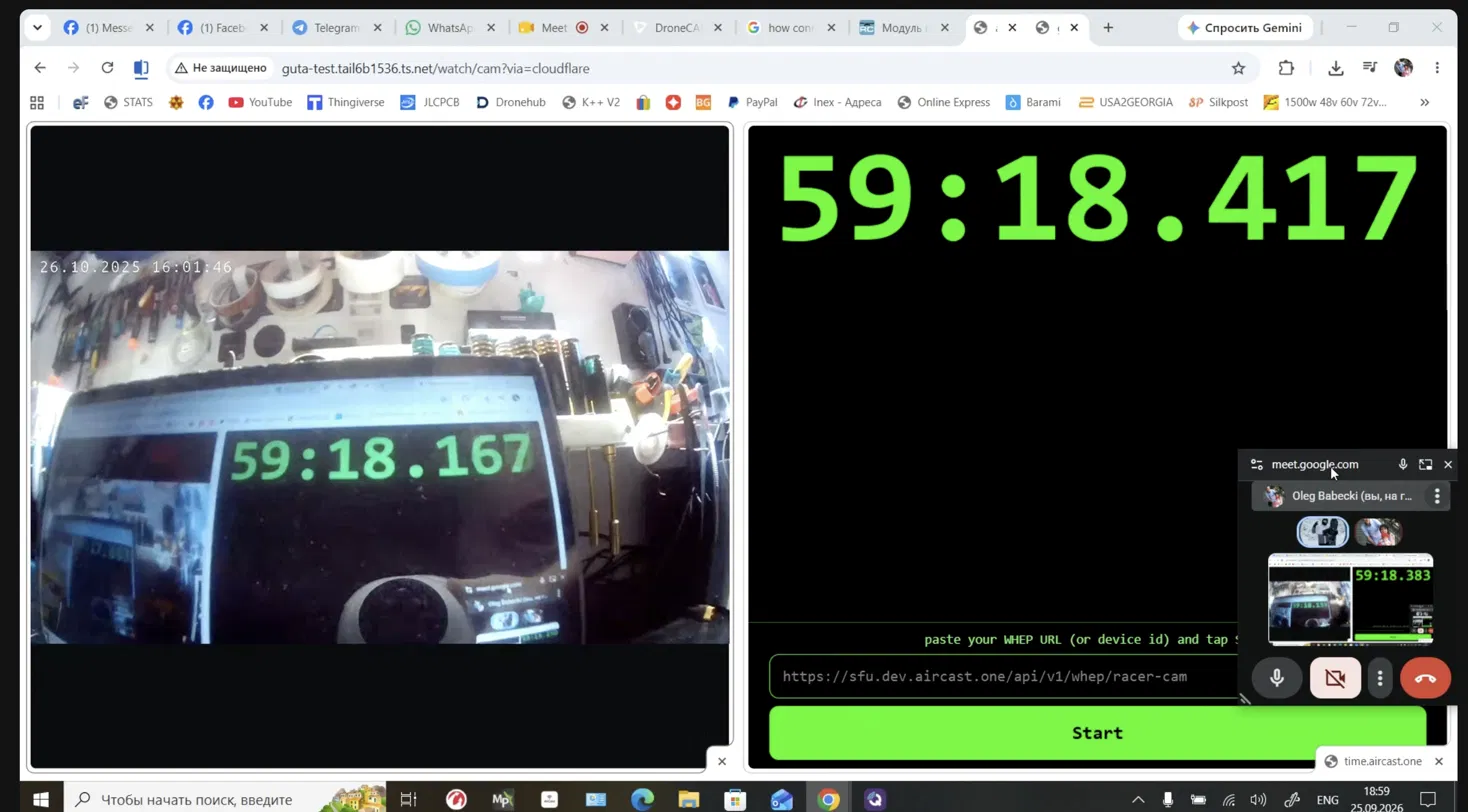
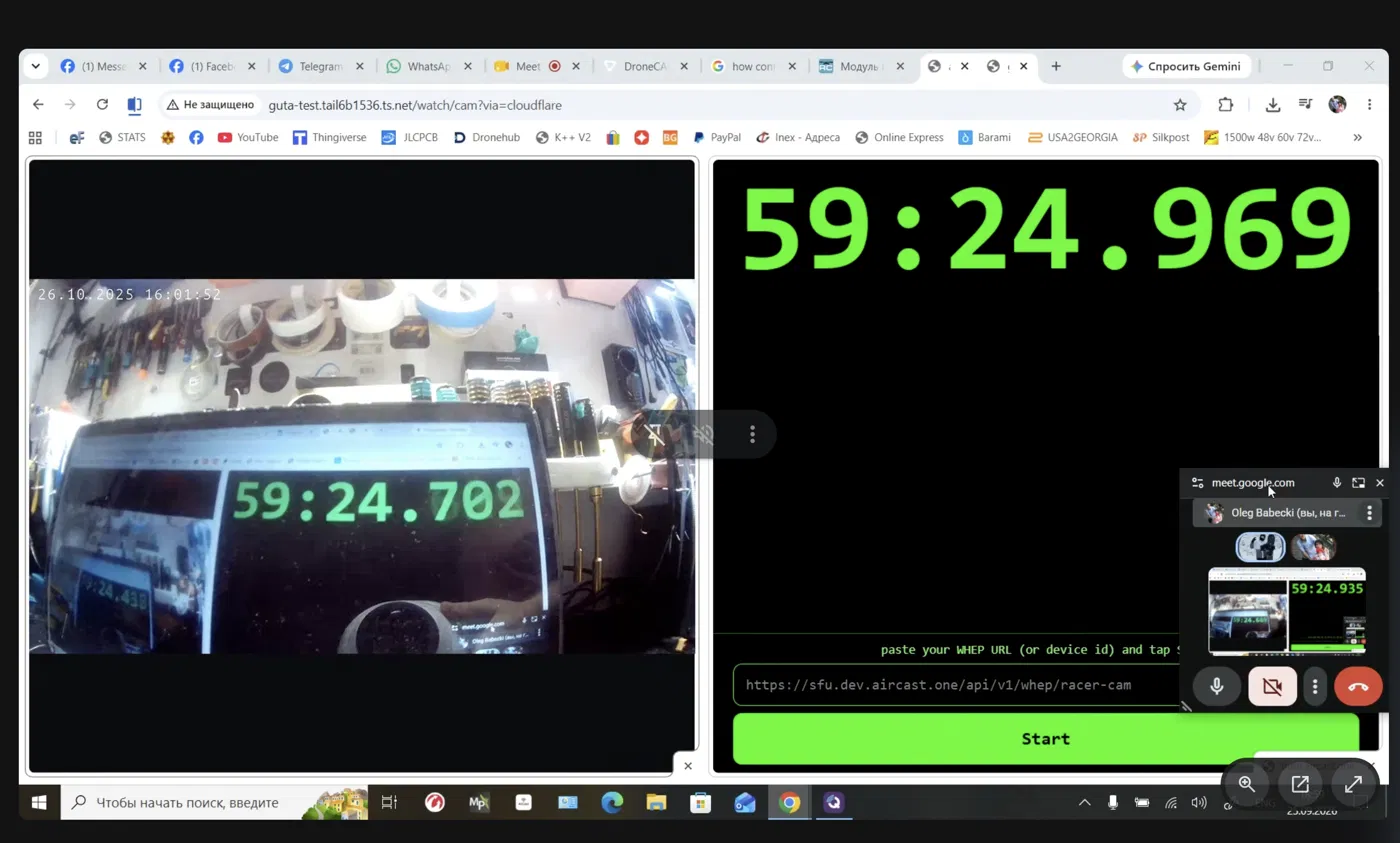
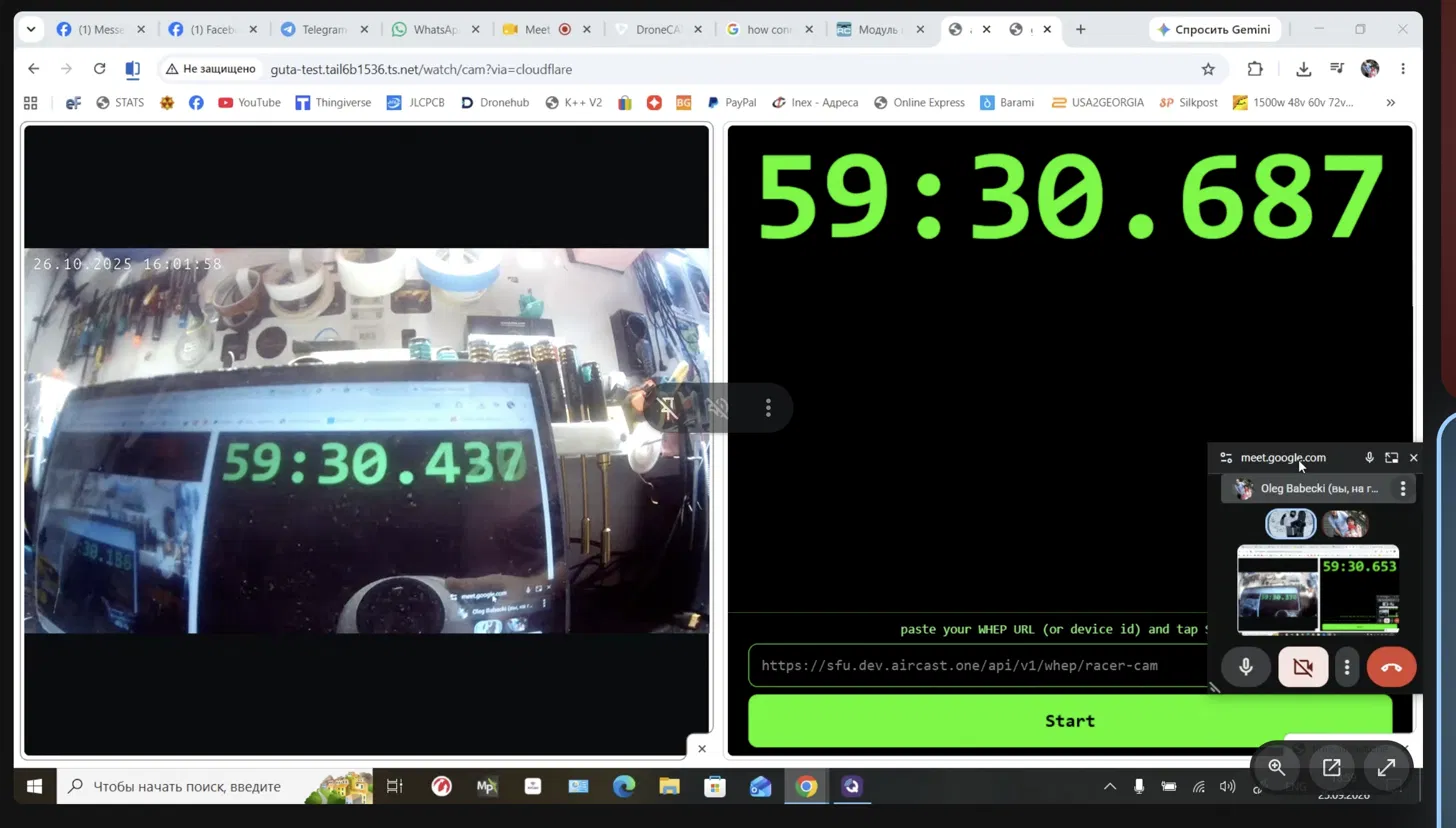
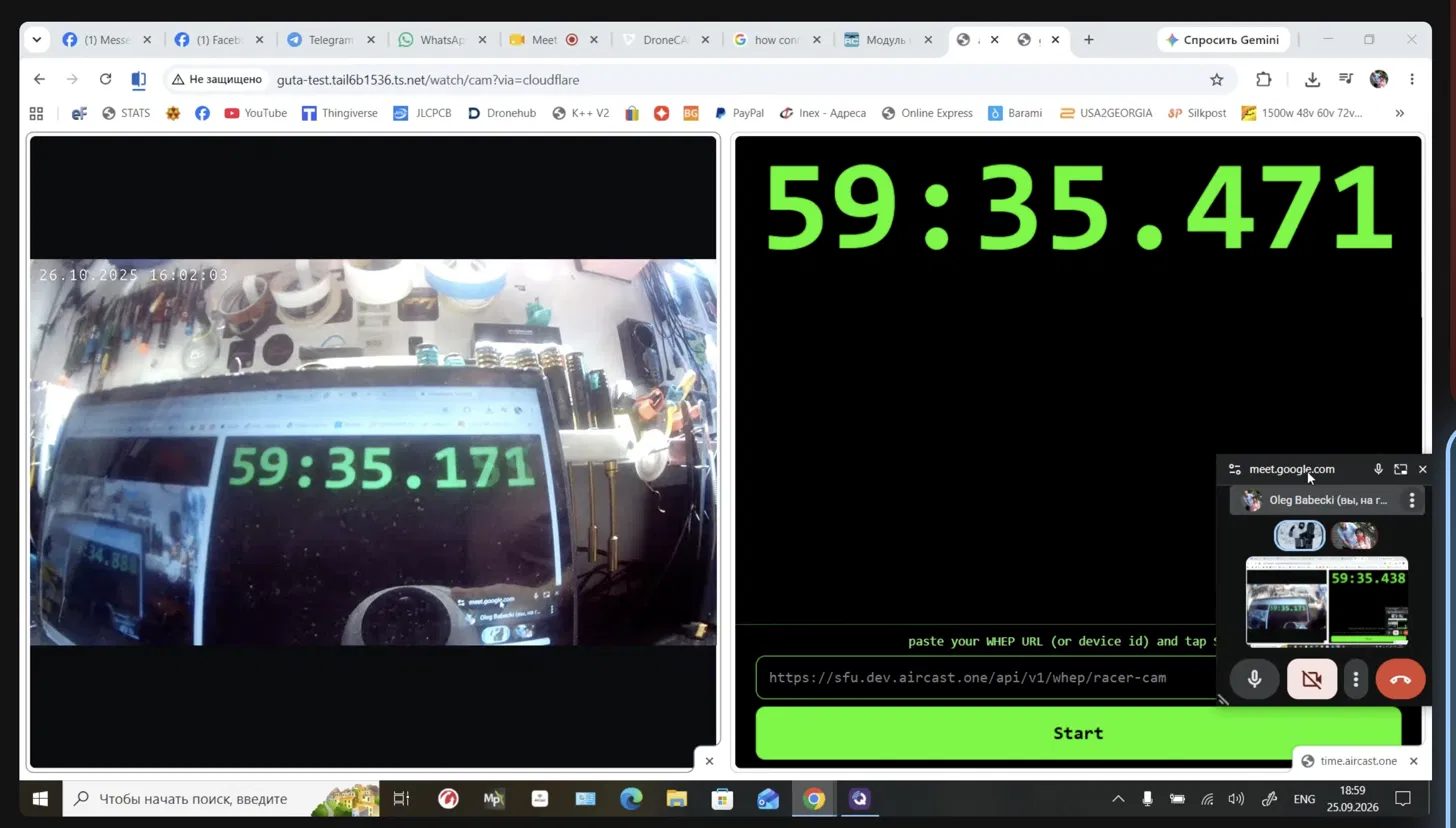
| Cloudflare, played in the browser | OpenIPC | Browser (WHEP) | ~265 ms |
What the numbers say
- Cloudflare is the fastest path. Same OpenIPC camera, same browser player: Cloudflare lands at ~265 ms against ~339 ms direct over Tailscale, about 75 ms faster. The Tailscale path was almost certainly relayed through a DERP server rather than peer-to-peer.
- QGC and the browser are on par. QGC measured ~15-20 ms slower than the browser, which is inside the measurement error.
- RTSP costs ~25-30 ms over WebRTC and is a little less stable, most likely from the receive-side jitter buffer rather than the network.
- Most of the budget is upstream. Roughly 250 ms is common to every path: sensor readout, encoder buffering and GOP, plus the receiver's jitter buffer. That's where the next big wins are.
How to read the screenshots
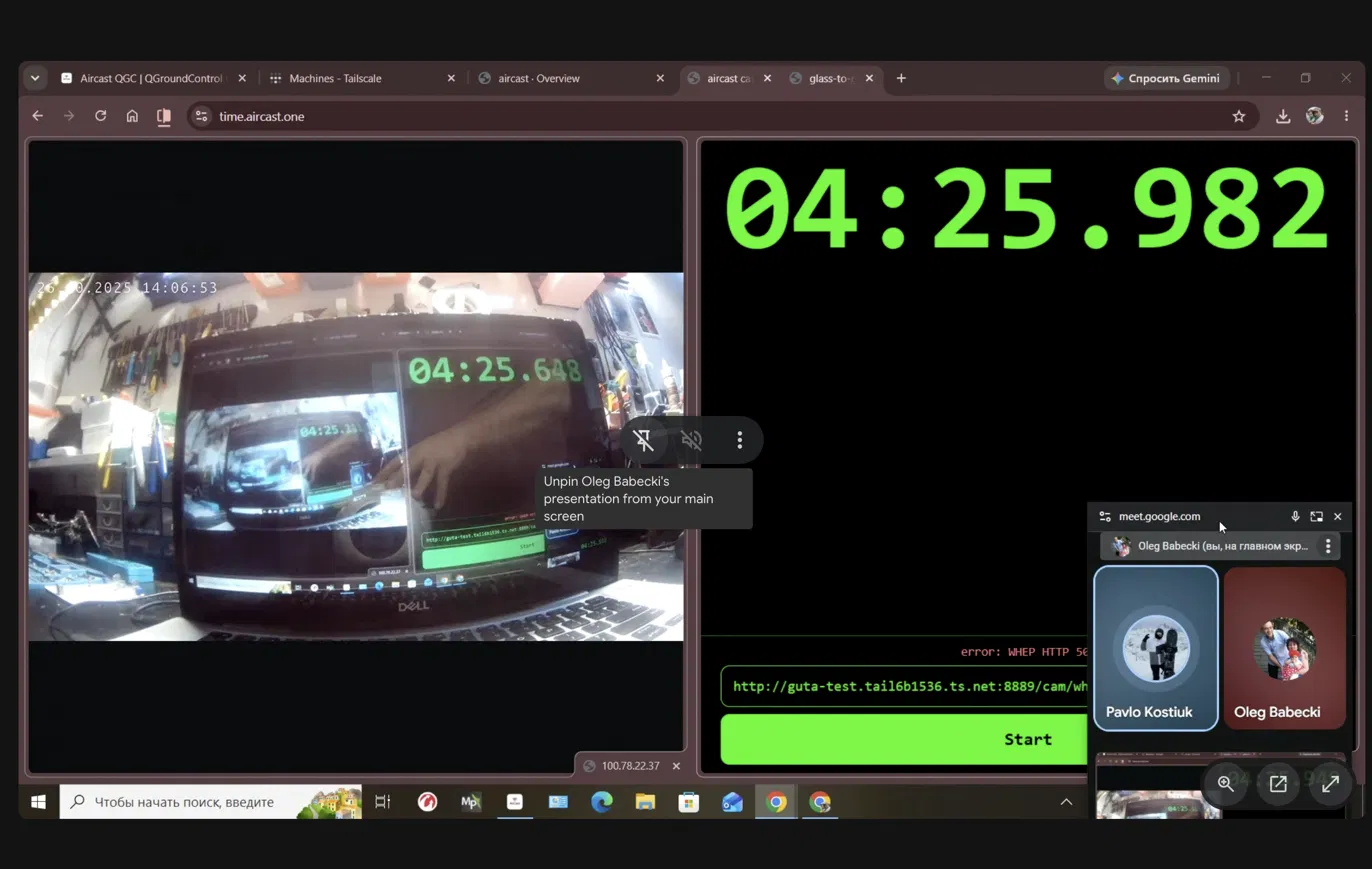
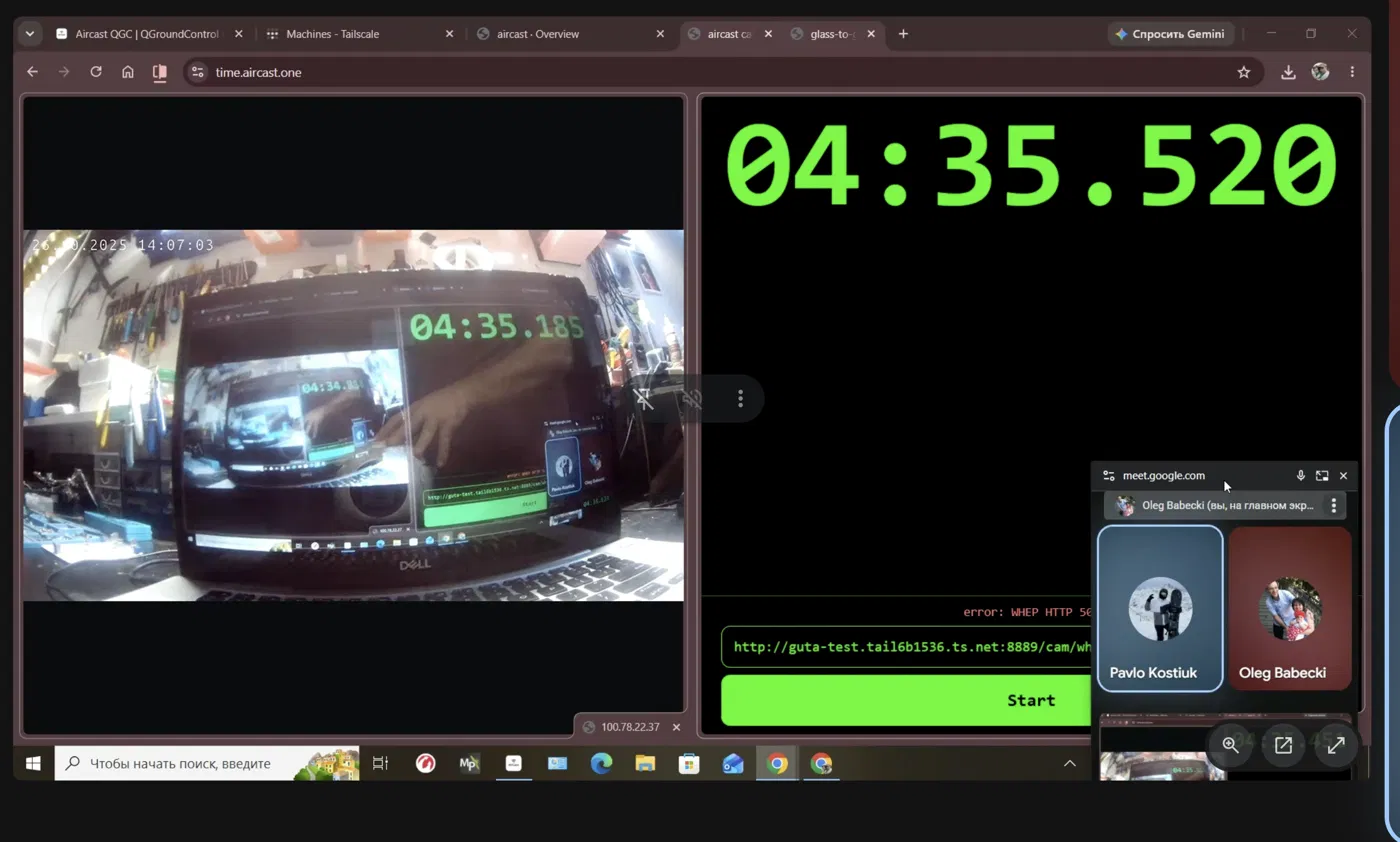
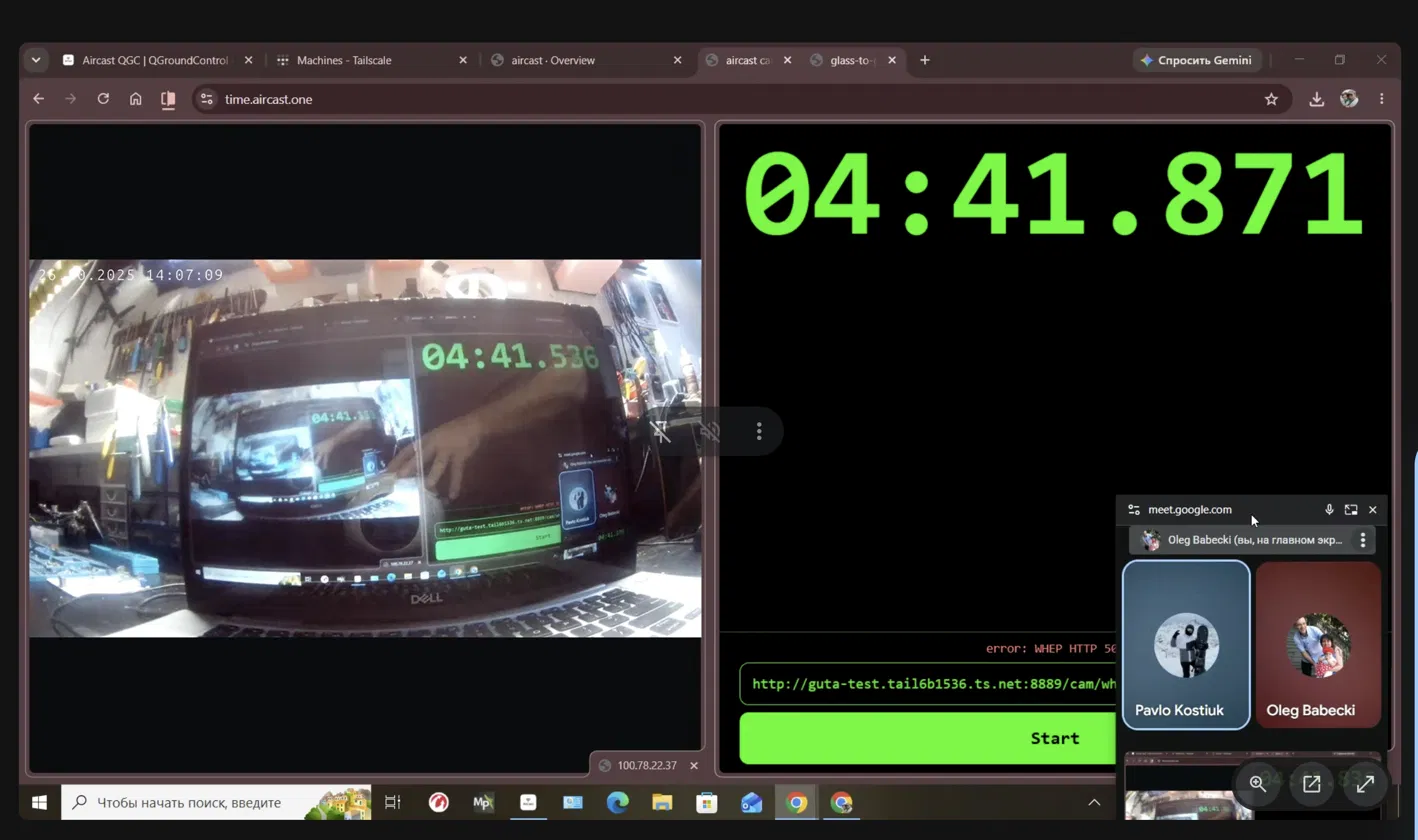
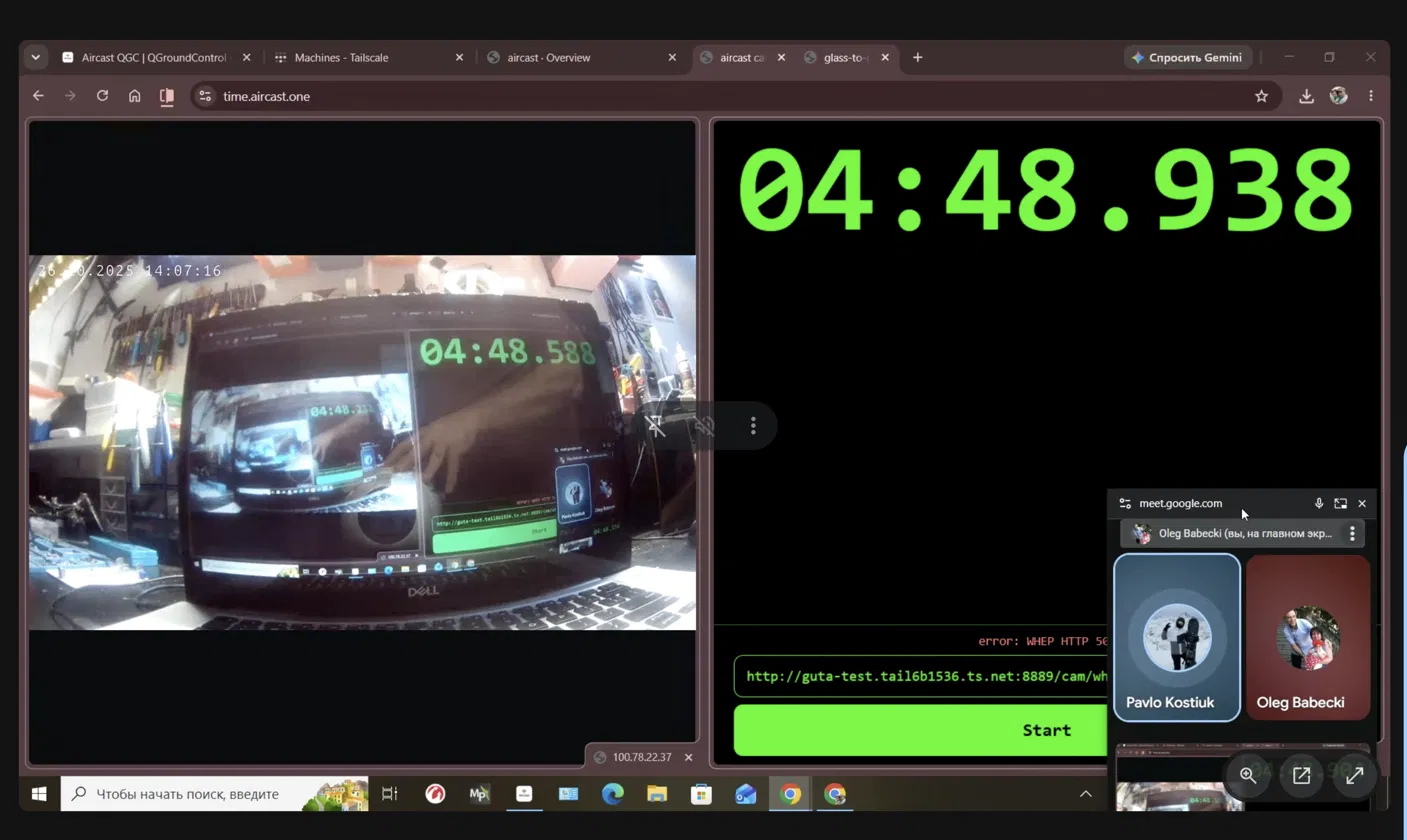
The large green clock is the reference. The camera feed shows the same clock filmed off a laptop screen, and because the laptop is also showing the stream, you can often see a second, recursive clock inside the feed that confirms the reading. Expect roughly ±20-30 ms of error from the camera frame interval, display refresh and exposure time. Where the last digit was motion-blurred we mark it x and round.
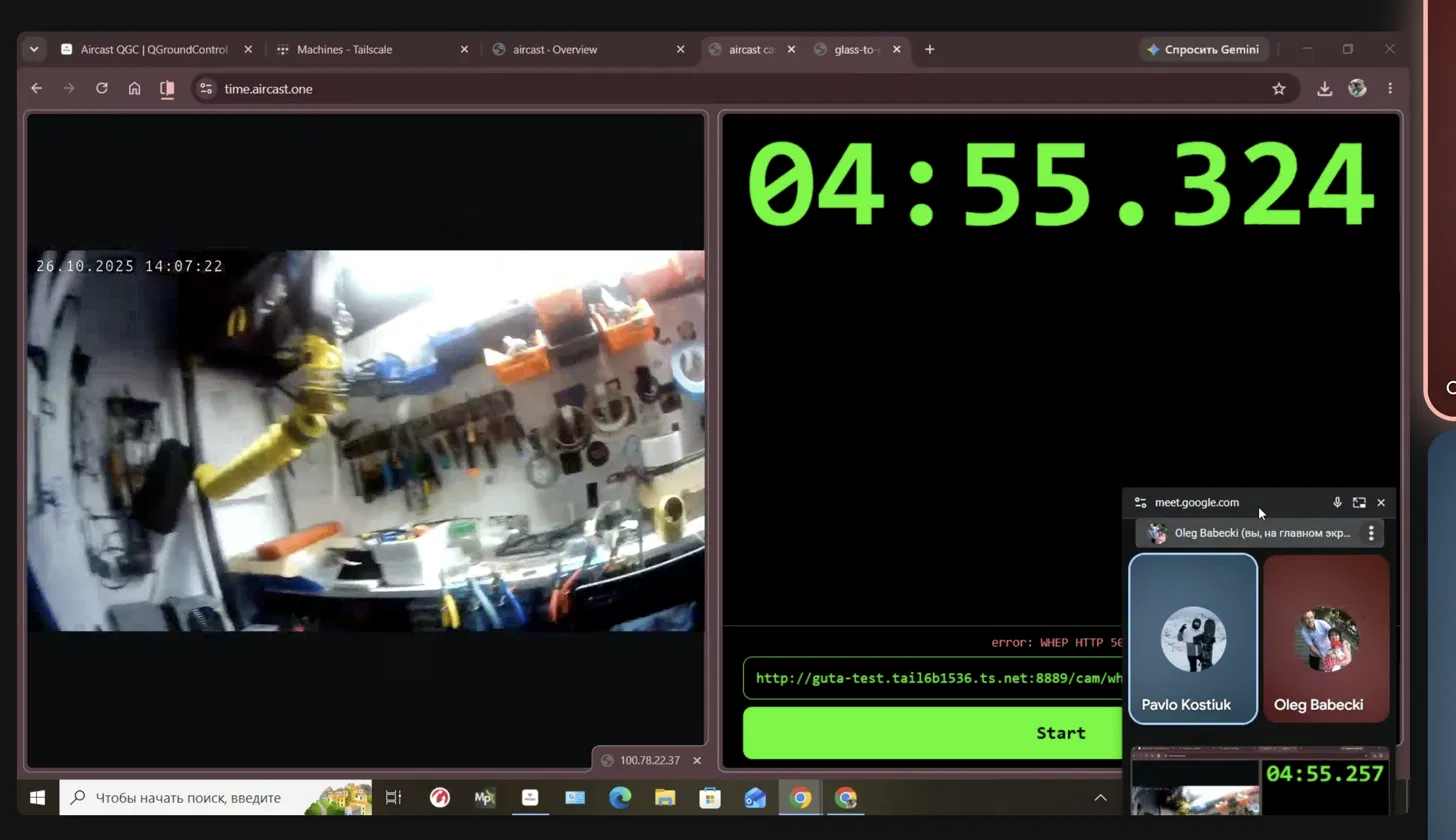
WHEP in the browser, direct over Tailscale: ~339 ms
Camera: OpenIPC. Player: Browser (WHEP).
| Frame | Reference | In video | Latency |
|---|---|---|---|
| 1 | 04:25.982 | 04:25.648 | 334 ms |
| 2 | 04:35.520 | 04:35.185 | 335 ms |
| 3 | 04:41.871 | 04:41.536 | 335 ms |
| 4 | 04:48.938 | 04:48.588 | 350 ms |
| 5 | n/a | camera turned away | n/a |
- Mean about 339 ms with very low jitter (334-350 ms).
- The recursive clocks inside the feed agree: in frame 2 the inner clock reads about 04:34.85, roughly 335 ms behind 04:35.185.
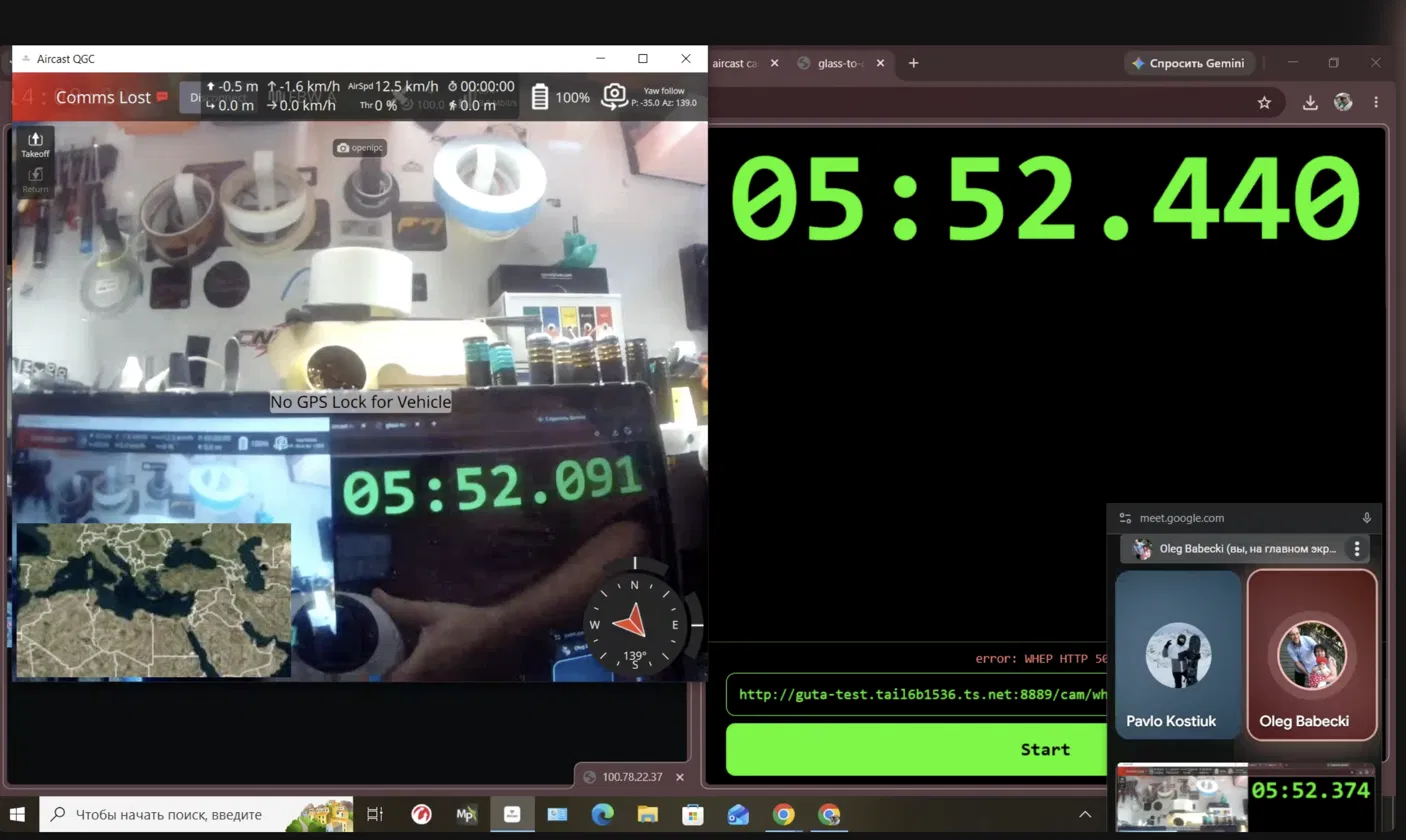
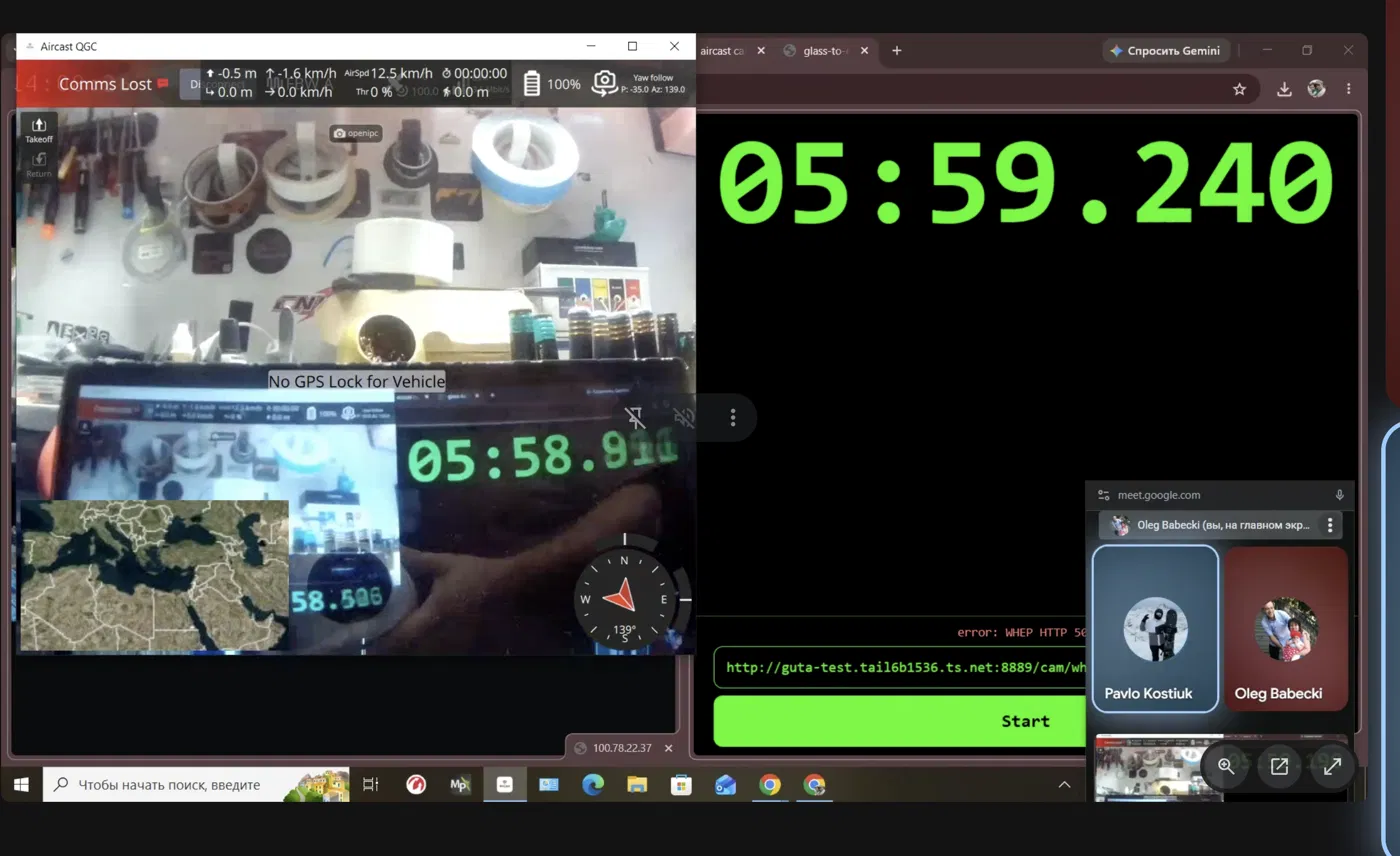
QGroundControl: ~356 ms
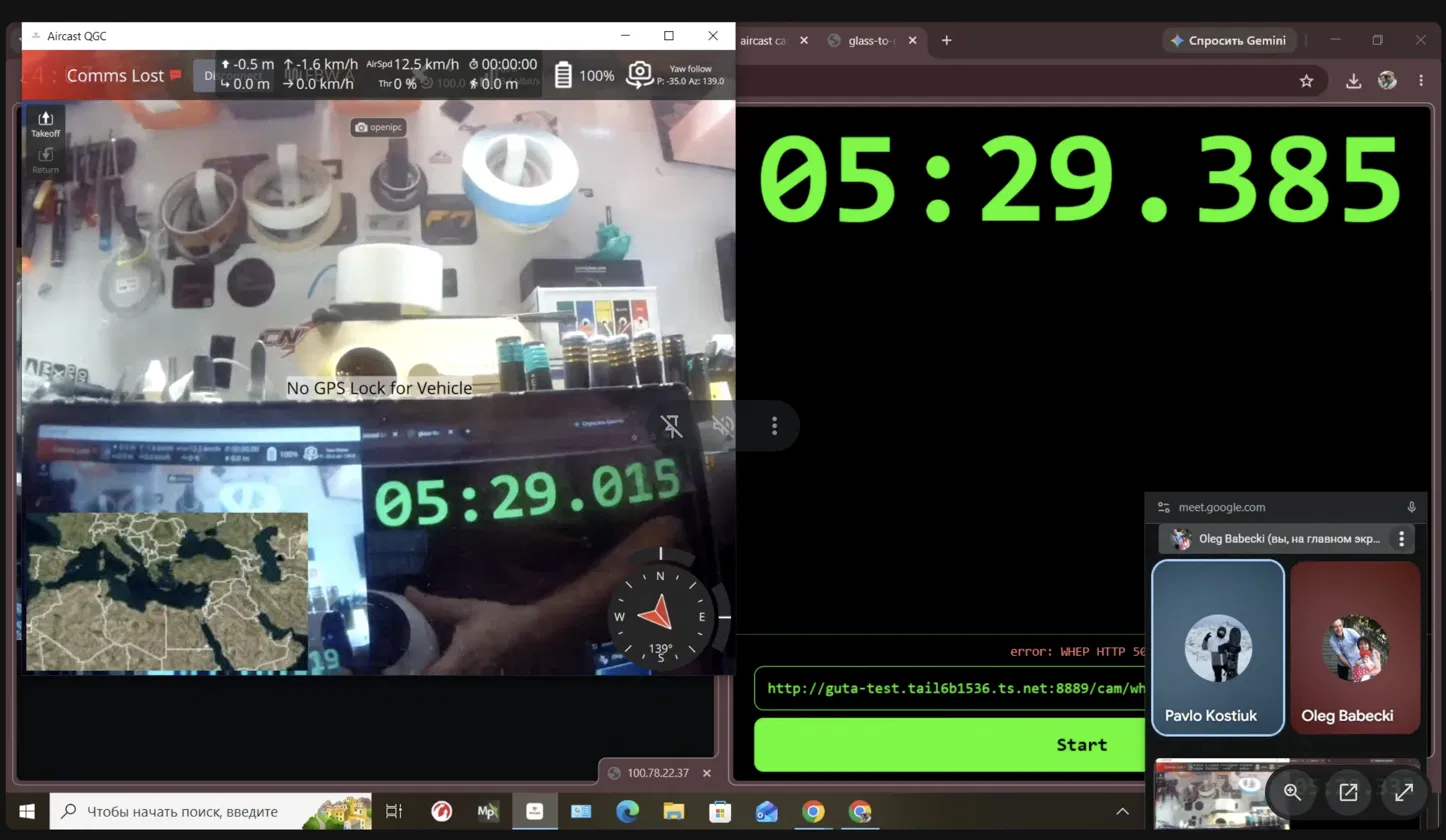
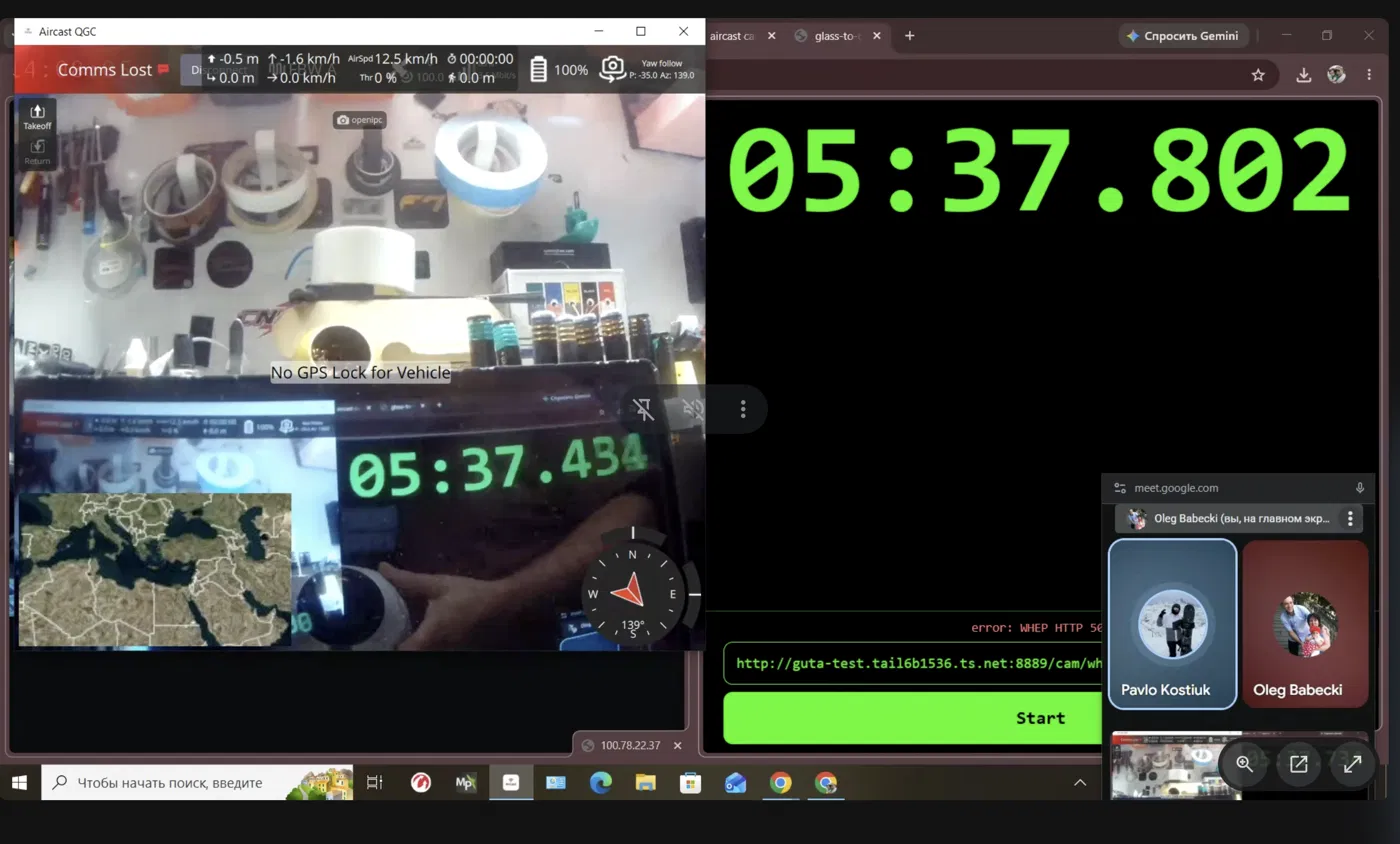
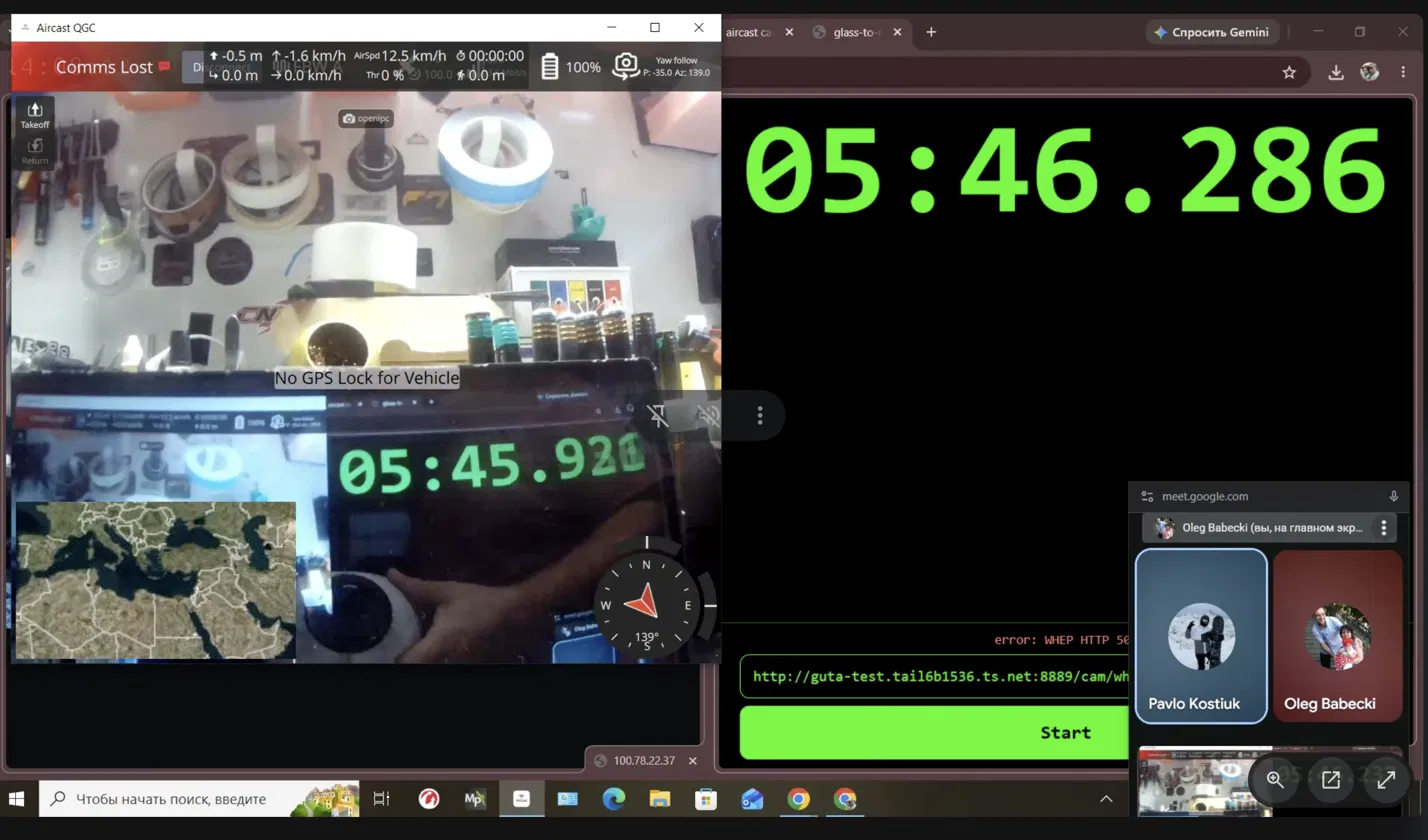
Camera: OpenIPC. Player: QGC.
| Frame | Reference | In video | Latency |
|---|---|---|---|
| 1 | 05:29.385 | 05:29.015 | 370 ms |
| 2 | 05:37.802 | 05:37.434 | 368 ms |
| 3 | 05:46.286 | 05:45.92x | ~362 ms |
| 4 | 05:52.440 | 05:52.091 | 349 ms |
| 5 | 05:59.240 | 05:58.91x | ~330 ms |
- Mean about 356 ms, spread 330-370 ms. Frames 3 and 5 have a motion-blurred last digit (±10 ms).
- About 15-20 ms slower than the browser player, which is within measurement error.
QGroundControl over RTSP: ~365 ms
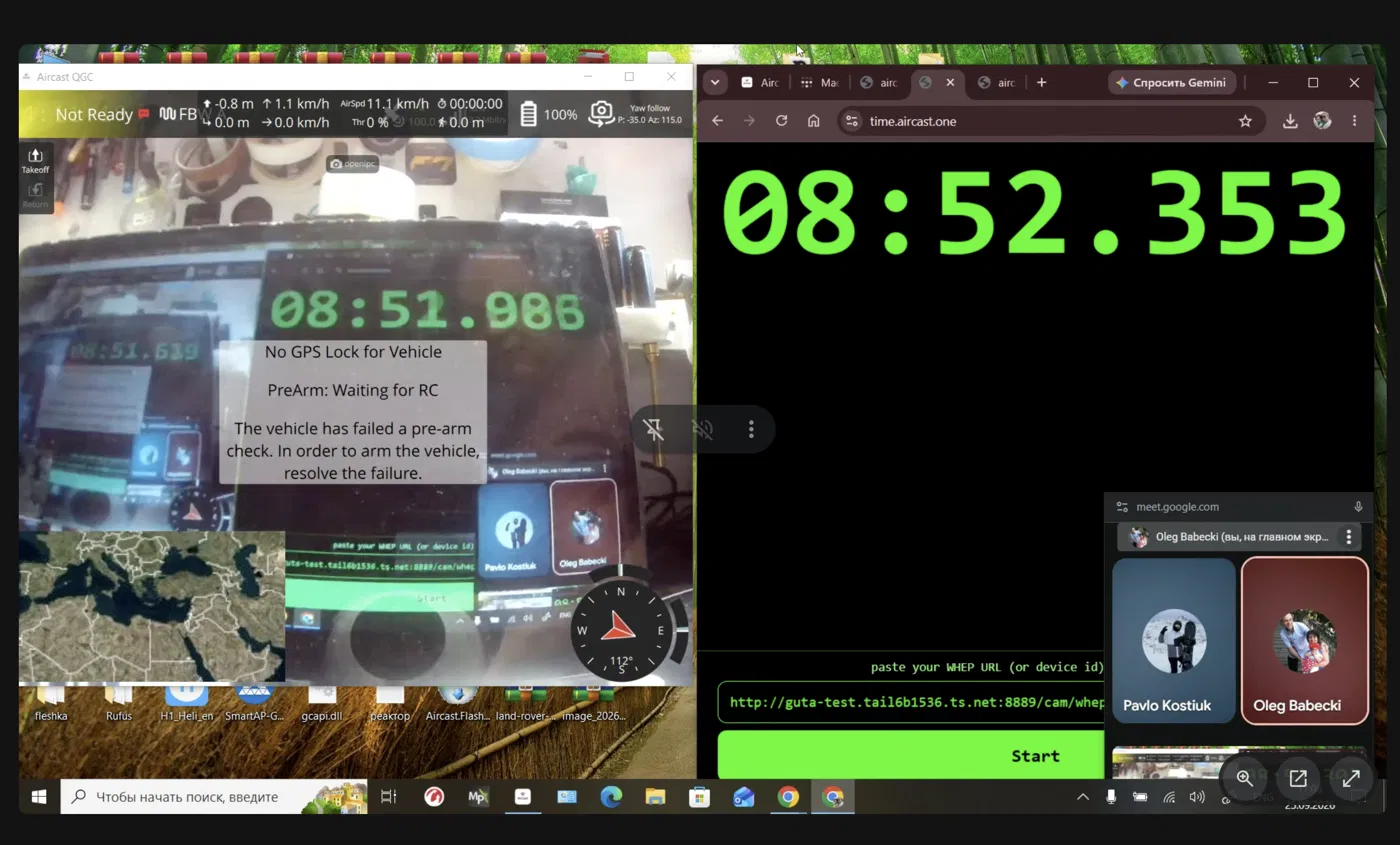
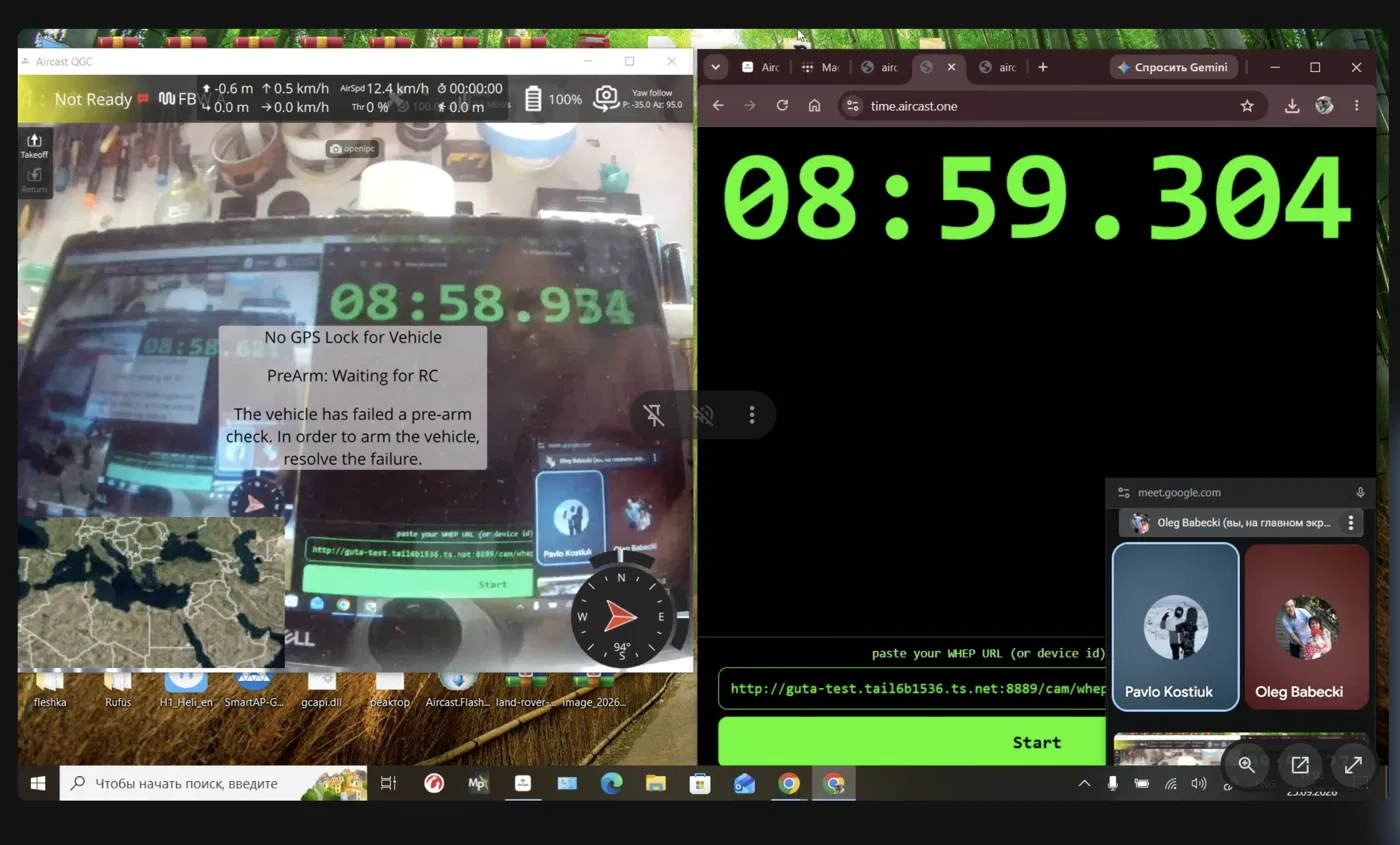
Camera: OpenIPC. Player: QGC (RTSP).
| Frame | Reference | In video | Latency |
|---|---|---|---|
| 1 | 08:52.353 | 08:51.986 | 367 ms |
| 2 | 08:59.304 | 08:58.934 | 370 ms |
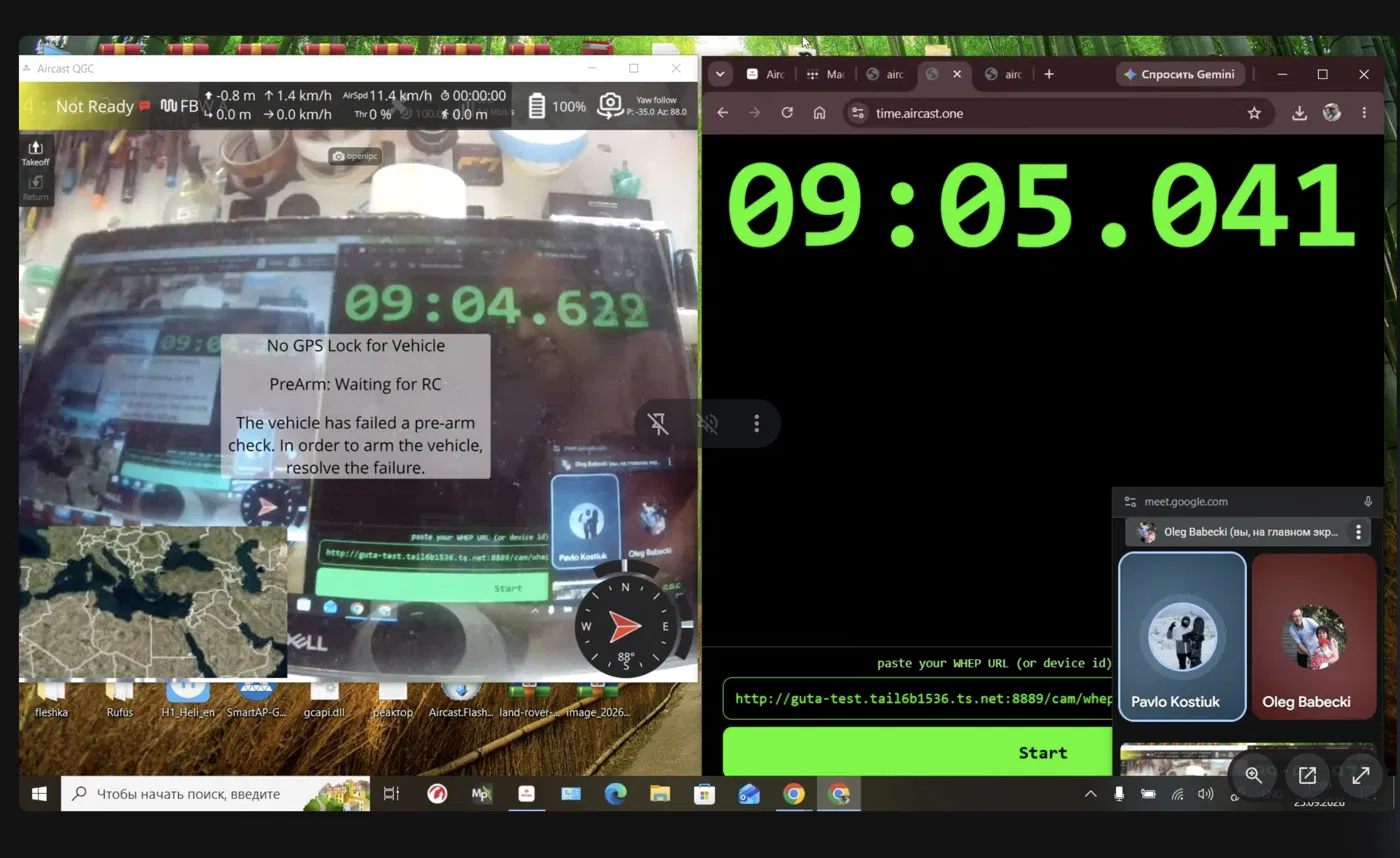
| 3 | 09:05.041 | 09:04.62x | ~418 ms |
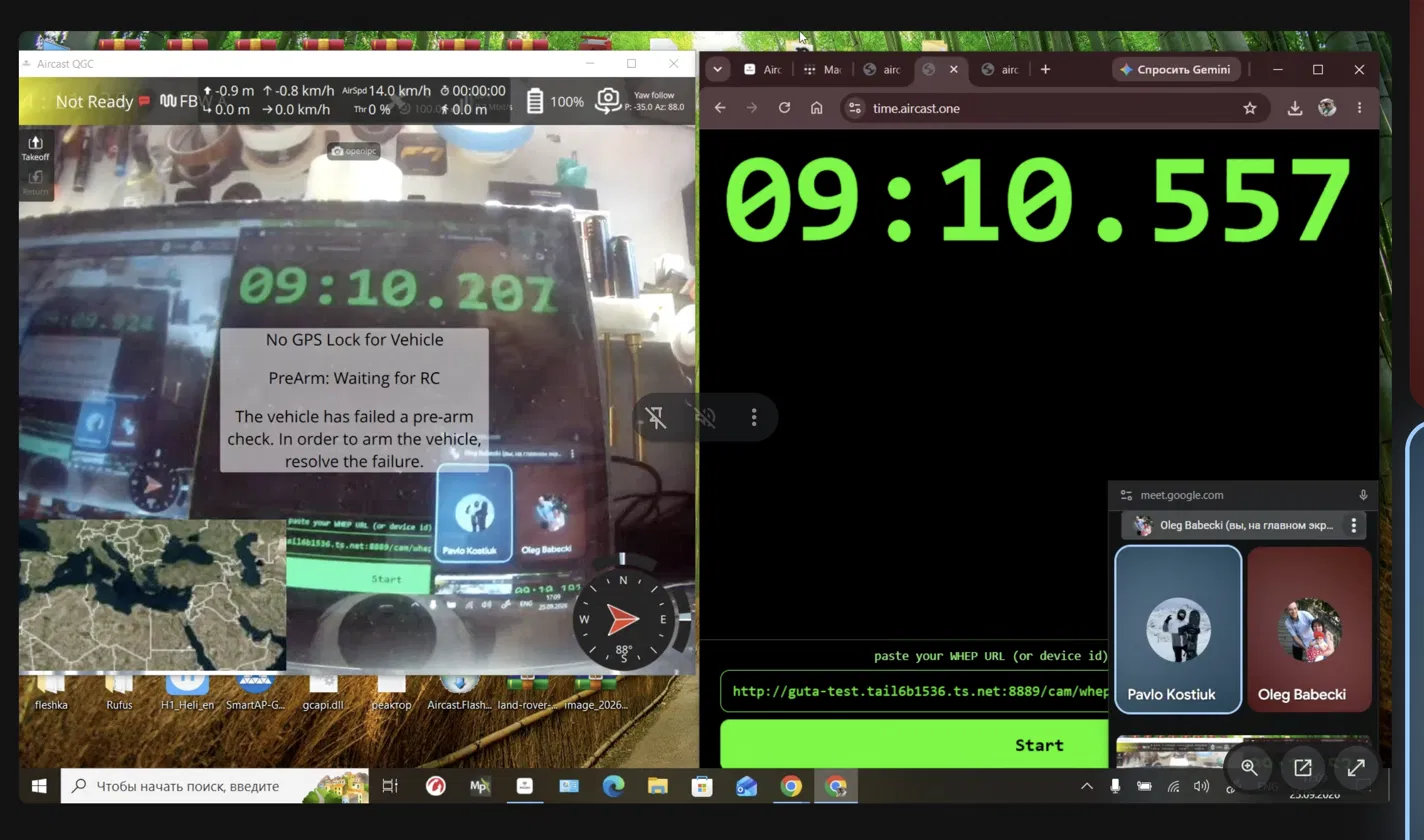
| 4 | 09:10.557 | 09:10.207 | 350 ms |
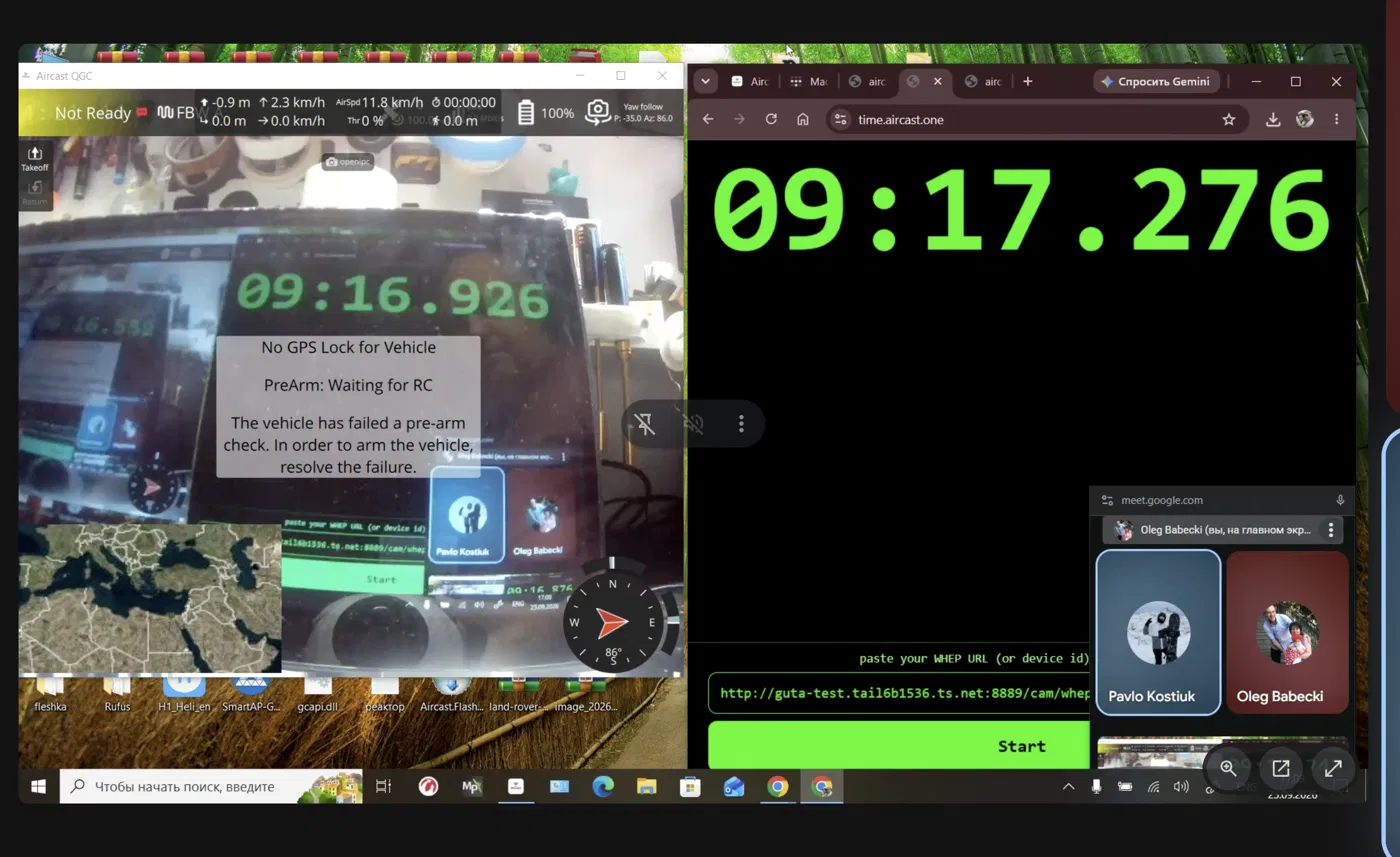
| 5 | 09:17.276 | 09:16.926 | 350 ms |
- Median about 365 ms; the mean is about 370 ms because frame 3 spiked (a jitter spike or a blurred digit).
- The rest sit in two clusters, 350 and 367-370 ms, half a frame apart at 30 fps, so that spread is frame quantization.
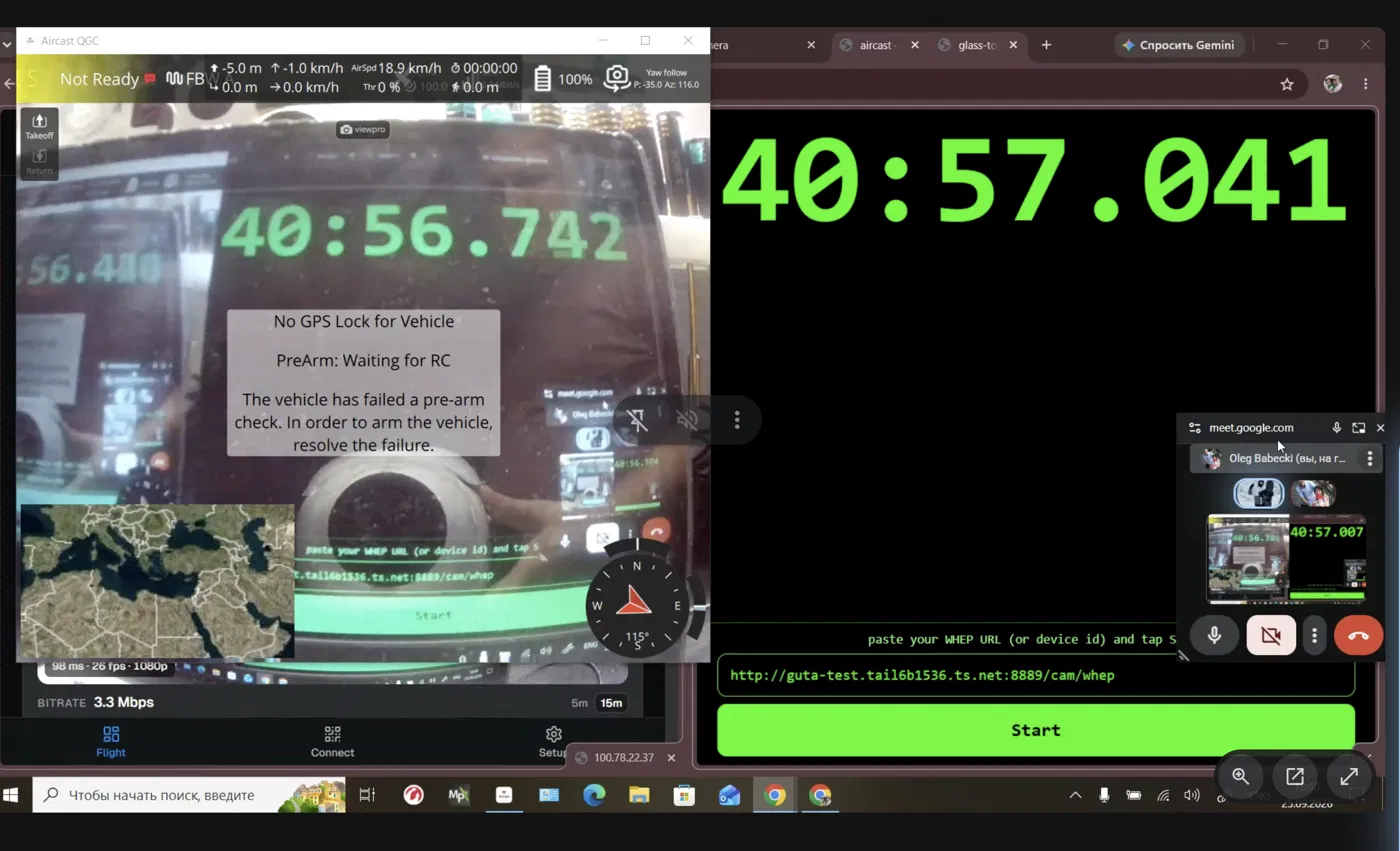
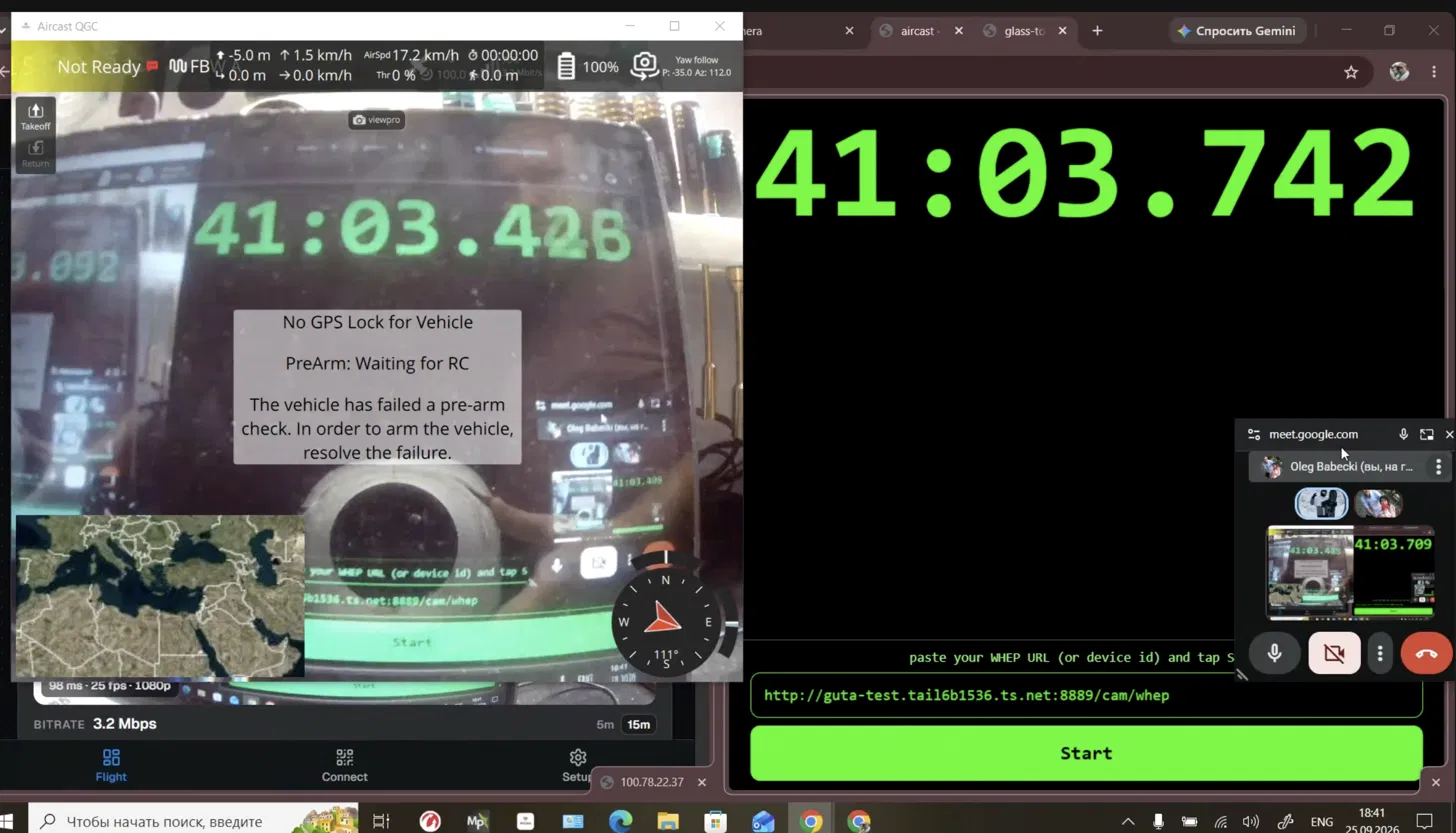
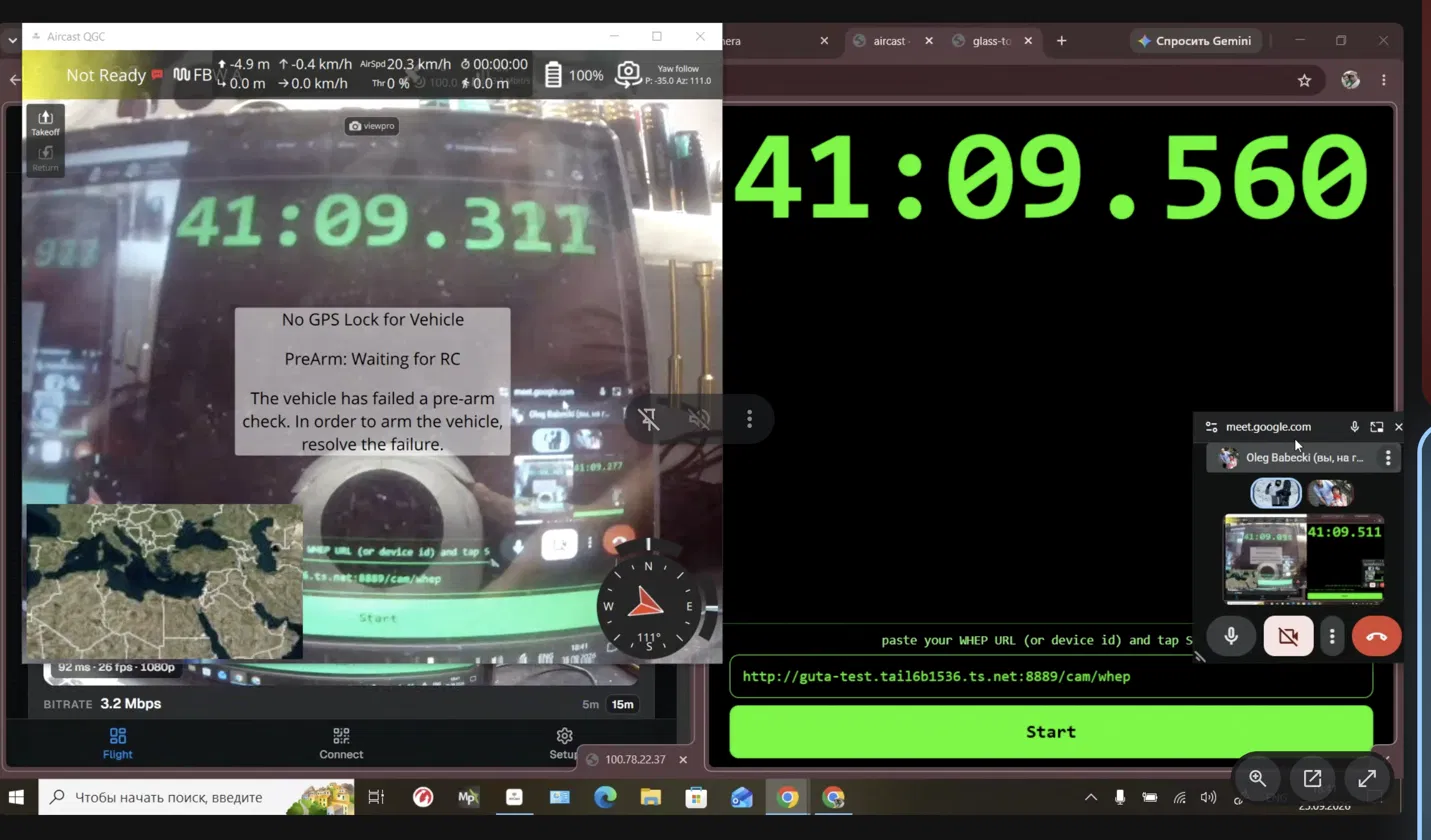
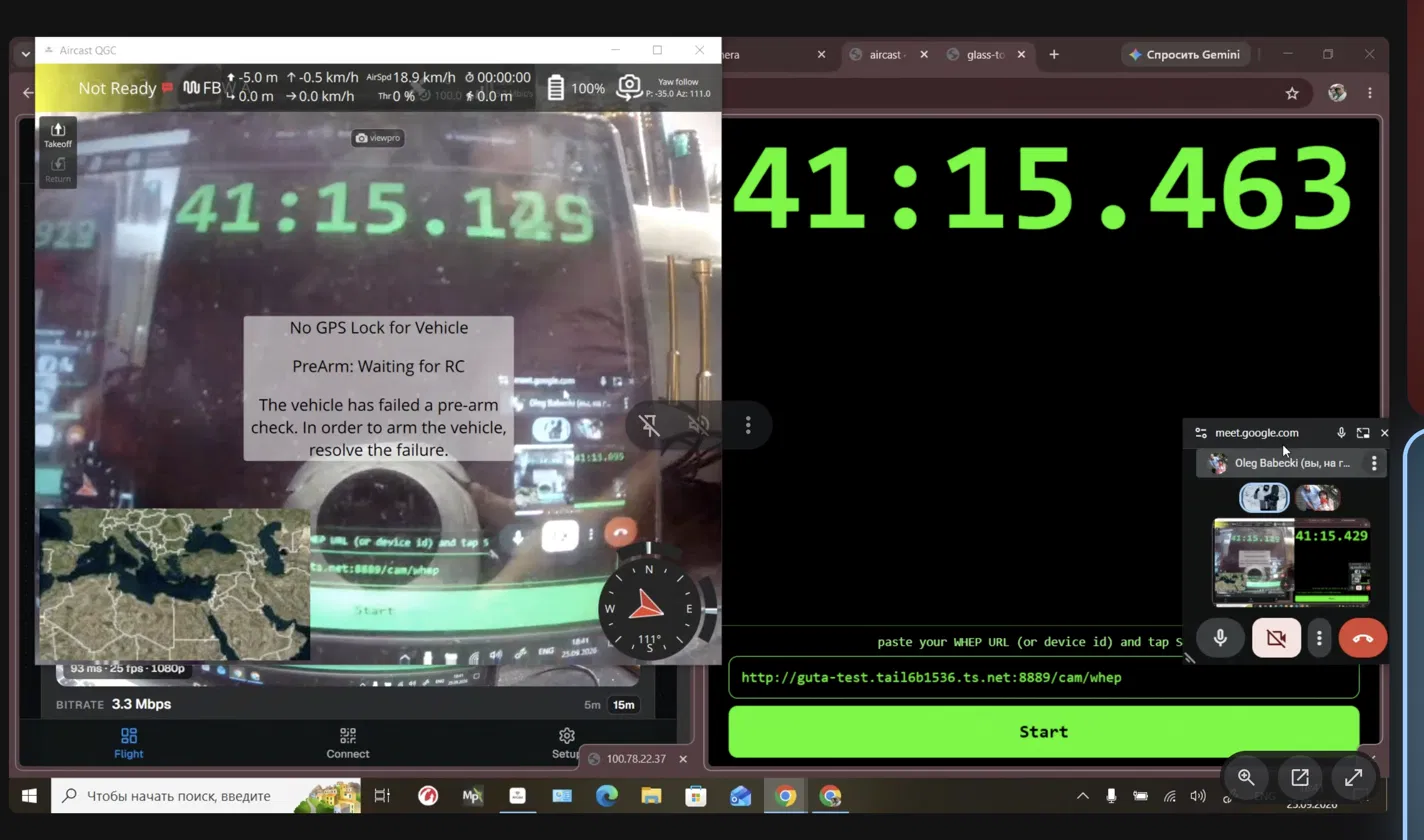
Cloudflare, played in QGroundControl: ~300 ms
Camera: ViewPro (1080p25, ~3.2 Mbps). Player: QGC.
| Frame | Reference | In video | Latency |
|---|---|---|---|
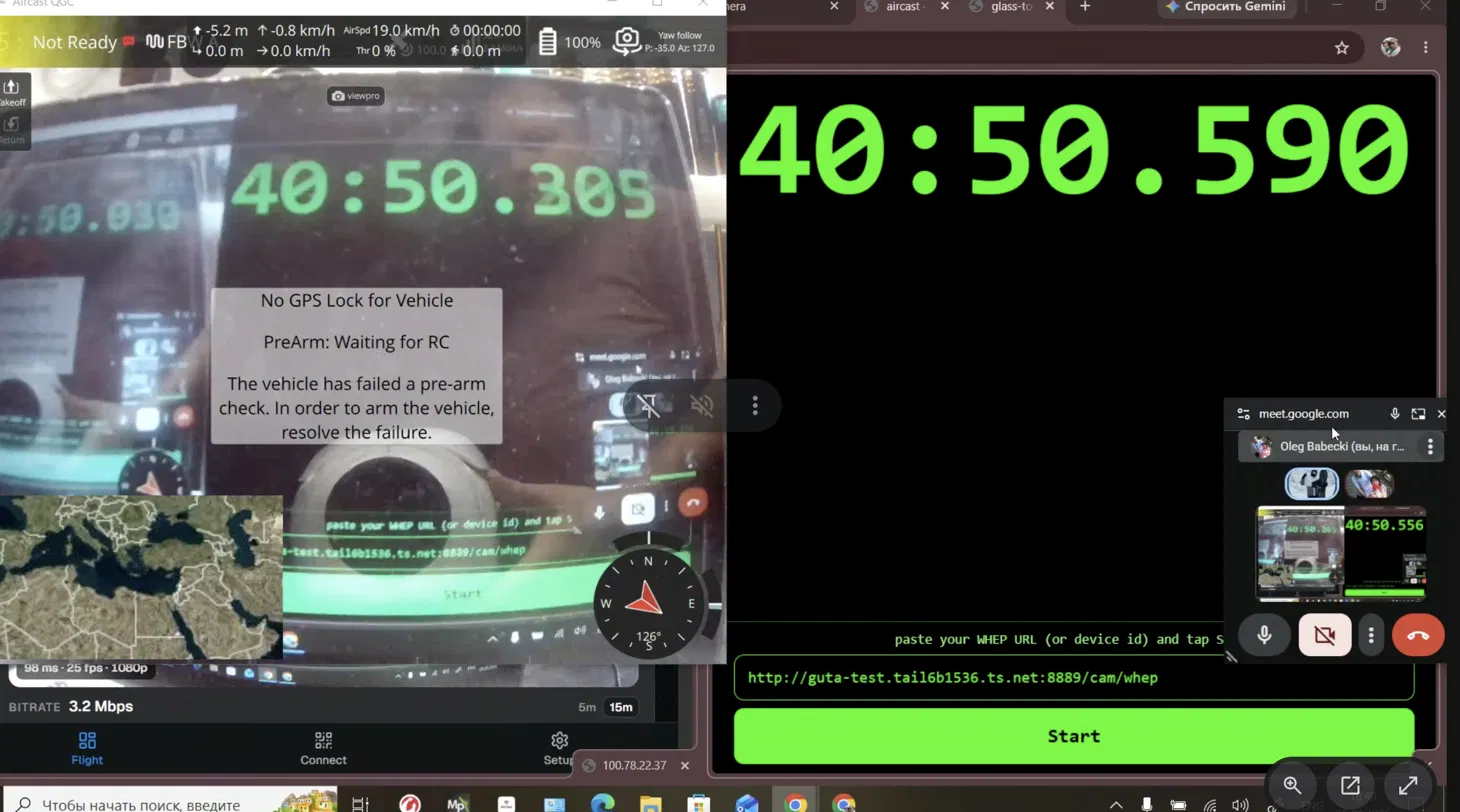
| 1 | 40:50.590 | 40:50.305 | 285 ms |
| 2 | 40:57.041 | 40:56.742 | 299 ms |
| 3 | 41:03.742 | 41:03.42x | ~315 ms |
| 4 | 41:09.560 | 41:09.311 | 249 ms |
| 5 | 41:15.463 | 41:15.12x | ~335 ms |
- Mean about 296 ms, median about 299 ms. The 250-335 ms spread is roughly ±2 frames at 25 fps, jitterier than the other runs.
- The camera changed for this run, so part of the gain may come from the camera rather than Cloudflare.
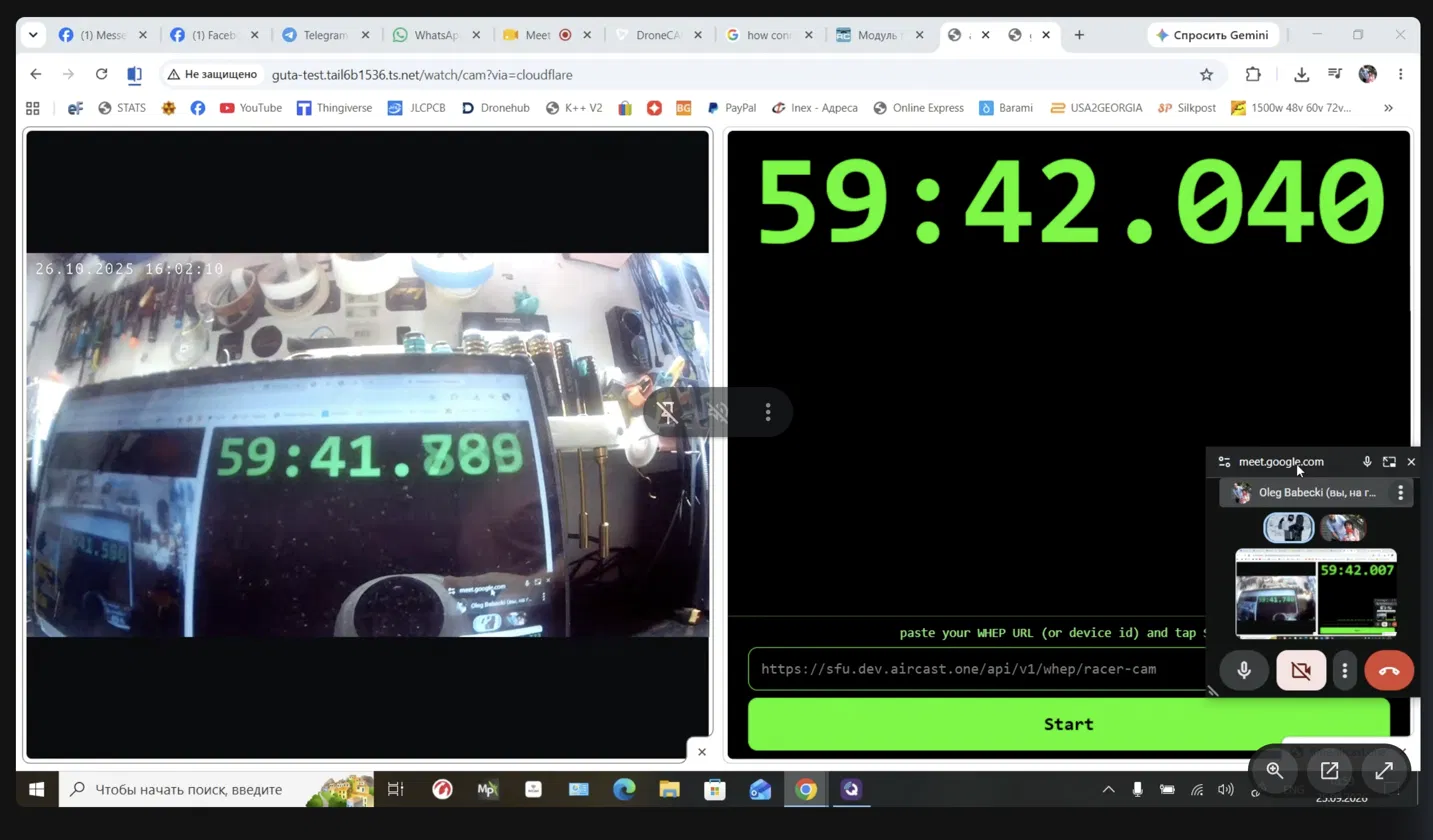
Cloudflare, played in the browser: ~265 ms
Camera: OpenIPC. Player: Browser (WHEP).
| Frame | Reference | In video | Latency |
|---|---|---|---|
| 1 | 59:18.417 | 59:18.167 | 250 ms |
| 2 | 59:24.969 | 59:24.702 | 267 ms |
| 3 | 59:30.687 | 59:30.437 | 250 ms |
| 4 | 59:35.471 | 59:35.171 | 300 ms |
| 5 | 59:42.040 | 59:41.789 | 251 ms |
- Mean about 264 ms, median about 250 ms. Three of five frames land on 250 ms, the likely steady state; frame 4 is a one-frame hiccup.
- The inner clocks cross-check: frame 3 gives 30.437 − 30.188 = 249 ms.
Caveats
- The Cloudflare-in-QGC run used a different camera (ViewPro instead of OpenIPC), so it isn't a clean transport comparison. It came in ~35 ms slower than Cloudflare in the browser; the camera, the QGC player, or both account for that.
- Five frames per path is a spot check, not a statistical benchmark.
- Screen sharing over Google Meet was used to capture the frames. It doesn't affect the numbers because both clocks are in the same shared frame.
Want to reproduce this on your own setup? Start with streaming drone video over 4G/LTE.